At telaHosting, all shared, business, and reseller hosting accounts have resource limits and LVE monitoring to ensure your account runs smoothly and securely. These limits prevent any single account from overloading server resources (like CPU, RAM, or disk access), which could slow down other websites on the same server.
We use the CloudLinux operating system with a feature called LVE (Lightweight Virtual Environment). This technology ensures every website on the server gets a fair share of resources, so no single account can dominate.
Our resource limits are generous, often higher than other hosting providers, giving your website plenty of room to grow. We achieve this because:
- High-Performance Servers: Our servers use fast AMD, LiteSpeed Magic and NVMe-SSD storage for quick data access.
- Fewer Accounts per Server: Unlike competitors who overcrowd servers to cut costs, we host fewer accounts per server, ensuring better performance and reliability.
Resource Limits for telaHosting Accounts
Below are the resource limits for our shared (WordPress and cPanel) and reseller hosting plans. These limits cover CPU, memory, disk speed, and processes. Higher-tier plans offer more resources for busier websites.
Note: During traffic spikes, your account may use “burst” resources to stay stable. If you consistently hit limits, consider upgrading to a plan with more resources. Contact our support team to upgrade anytime.
| Package |
CPU Speed |
Physical Memory (PMEM) |
I/O Speed |
IOPS |
Entry Processes (EP) no. |
Number of Processes (NPROC) |
Inodes |
| WP Basic |
50% |
1GB |
1MB/s |
1024 |
20 |
100 |
300,000 |
| WP Pro |
100% |
1.5GB |
1.5MB/s |
1024 |
20 |
100 |
600,000 |
| WP Advanced |
100% |
2GB |
2MB/s |
1024 |
30 |
250 |
800,000 |
| WP Ultimate |
100% |
3GB |
3MB/s |
1024 |
40 |
400 |
Unlimited |
| Package |
CPU Speed |
Physical Memory (PMEM) |
I/O Speed |
IOPS |
Entry Processes (EP) no. |
Number of Processes (NPROC) |
Inodes |
| Starter cPanel |
50% |
1GB |
1MB/s |
1024 |
20 |
100 |
300,000 |
| Elite cPanel |
100% |
1.5GB |
1.5MB/s |
1024 |
20 |
150 |
600,000 |
| Elite-Pro cPanel |
100% |
2GB |
2MB/s |
1024 |
30 |
250 |
800,000 |
| Premium cPanel |
100% |
3GB |
3MB/s |
1024 |
40 |
400 |
Unlimited |
| Package |
CPU Speed |
Physical Memory (PMEM) |
I/O Speed |
IOPS |
Entry Processes proviene (EP) no. |
Number of Processes (NPROC) |
Inodes |
| Starter Reseller |
100% |
3GB |
3MB/s |
1024 |
40 |
300 |
Unlimited |
| Growth Reseller |
100% |
4GB |
4MB/s |
1024 |
60 |
300 |
Unlimited |
| Pro Reseller |
100% |
5GB |
5MB/s |
1024 |
90 |
400 |
Unlimited |
| Master Reseller |
100% |
6GB |
6MB/s |
1024 |
200 |
500 |
Unlimited |
How to Check Your Resource Usage
You can monitor your resource usage directly from your cPanel account. Here’s how:
- Log in to your cPanel.
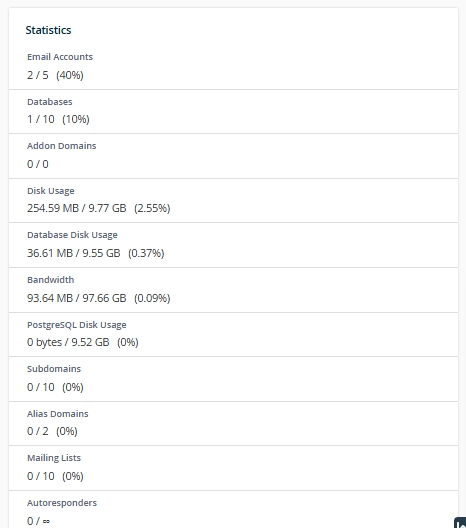
- Find the Statistics section on the left side of the dashboard.

Here’s what each metric means:
- CPU Usage: Shows how much of your allocated CPU power you’re using. If it hits 100%, your account is maxed out, and new tasks may be paused, causing your website to slow down or, in rare cases, time out.
- Virtual Memory Usage: This is the memory your processes can use within the LVE. If you exceed this limit, processes may fail, leading to errors.
- Physical Memory Usage (RAM): This is the actual RAM allocated to your account. If it’s maxed out, you might see PHP errors or, in extreme cases, a CloudLinux error page. These issues usually resolve once usage drops below the limit.
- Entry Processes: Tracks how many processes (like PHP or CGI scripts) are running at once. Each visitor loading a PHP page creates an entry process. It’s not the same as the number of website visitors—processes end quickly, so hitting the limit is rare unless you have many simultaneous visitors.
- Number of Processes: Includes all processes (not just PHP or CGI) created by your account, like SSH or cron jobs. These typically use minimal resources.
- I/O Usage (Input/Output): Measures disk activity (reading/writing data). Hitting this limit slows down processes, especially for disk-heavy tasks like large backups.
For a detailed view:
- Go to the Metrics section in cPanel.
- Click Resource Usage.
- Select a time period from the Timeframe dropdown to view charts and tables.
If you frequently hit limits, you’ll see a warning in the Dashboard section of the Resource Usage menu, indicating the specific limit.
Why You Might See “Resource Limit Reached” Errors
Hitting a resource limit can slow your website or trigger errors like “Resource Limit Reached.” The error type depends on the limit reached:
- Error 508: Appears when entry processes are maxed out, preventing new processes to protect other accounts.
- CPU or I/O Limits: Your website may load slowly.
- Memory or Process Limits: You might see 500 or 503 errors, indicating the server can’t run your scripts.
Common causes include:
- Surge in Traffic: A sudden increase in visitors can overload your account.
- Background Scripts or Cron Jobs: Tasks like backups or heavy cron jobs can consume resources, especially with normal traffic.
- Web Crawlers: Search engines or bots scanning your site too often can strain resources.
- Faulty Scripts: Outdated or poorly coded plugins/scripts can create loops, using excessive resources.
- DDoS Attacks: Malicious attacks can overwhelm the server, making it unavailable.
What to Do if You Hit Limits
If you frequently hit resource limits, try these steps:
- Monitor Usage: Use cPanel’s Resource Usage tool to pinpoint the issue.
- Optimize Your Site: Update plugins, remove unnecessary scripts, or reduce cron job frequency.
- Upgrade Your Plan: Switch to a higher-tier plan with more resources. Contact our support team for assistance.
- Use Caching: Install caching plugins to reduce server load.
- Contact Support: Our team can help diagnose and resolve issues.
By managing your resource usage, you can keep your website running smoothly with telaHosting!


Need help? Our friendly support team is always here for you! Reach out below.
Happy hosting! 🌟